

Bitcoin and select altcoins have rebounded sharply off their support levels — a possible sign that traders are buying the recent dip in the market.
Bitcoin (BTC) is leading the cryptocurrency markets on the path to recovery. Although the United States Consumer Price Index (CPI) print for January was marginally higher than expectations, it did not dent the enthusiasm of bullish crypto traders.
A positive response to seemingly negative data is a sign that the sentiment is bullish and traders are looking for buying opportunities.
However, some analysts are cautious due to the strengthening of the U.S. Dollar Index (DXY). They believe that a sustained rally in the DXY could limit the upside in cryptocurrencies.
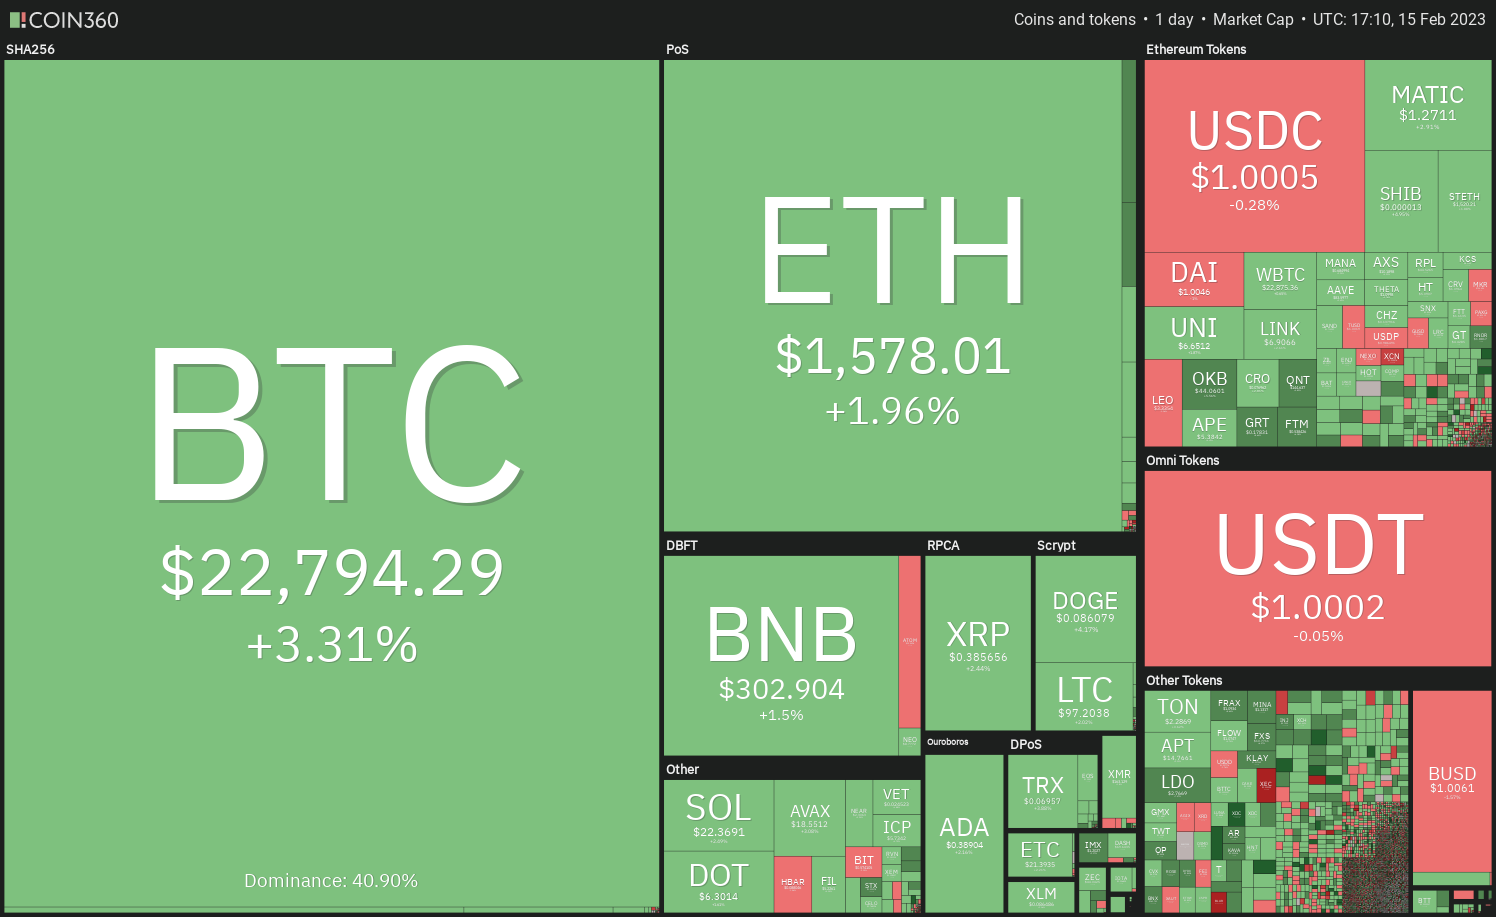
Usually, long-term downtrends are followed by a base formation. During this phase, several analysts remain skeptical about a rally, but the price action continues to surprise them. Although data is important, short-term traders should focus more on price action and devise a suitable strategy.
What are the critical levels to keep an eye on? Let’s study the charts of the top 10 cryptocurrencies to find out.
BTC/USDT
Bitcoin (BTC) bounced off the $21,480 level on Feb. 14 and reached the 20-day exponential moving average ($22,235). This shows that buyers are trying to arrest the correction near the 38.2% Fibonacci retracement level of $21,228. A shallow pullback is an indication that traders are buying on minor dips.
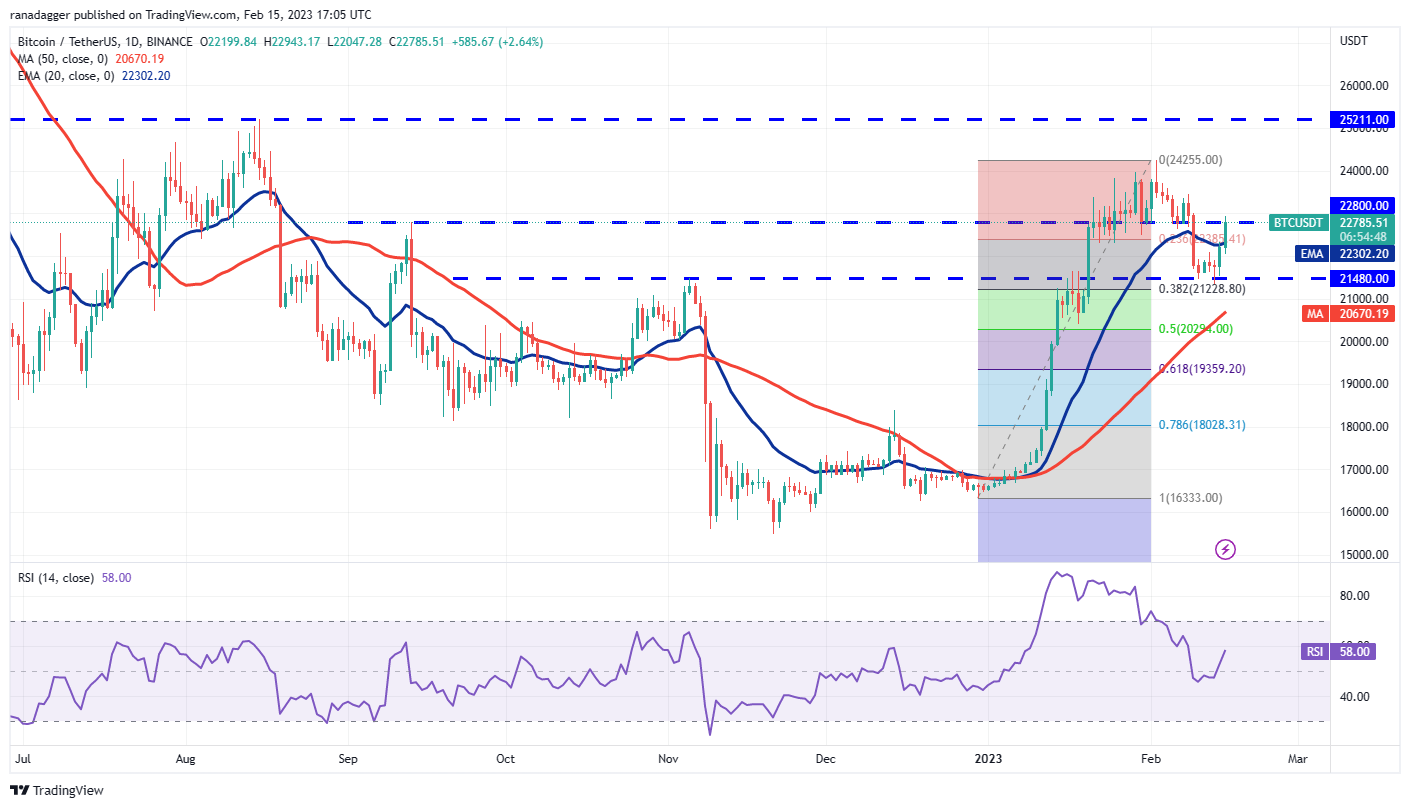
If bears want to strengthen their position, they will have to aggressively defend the $22,800 level and sink the price below $21,228. If they do that, the BTC/USDT pair may extend the correction to the 50% retracement level at $20,294. The deeper the correction, the longer it is likely to take for the next leg of the up-move to begin.
Conversely, if bulls drive and sustain the price above $22,800, the pair could rally to $23,500 and then to $24,255. The bears are expected to fiercely guard this zone. If the price turns down from it, the pair may remain range-bound between $21,228 and $24,255 for a few days.
ETH/USDT
Ether (ETH) continues to trade between the moving averages. The strong rebound off the 50-day simple moving average ($1,483) on Feb. 14 displays demand at lower levels.
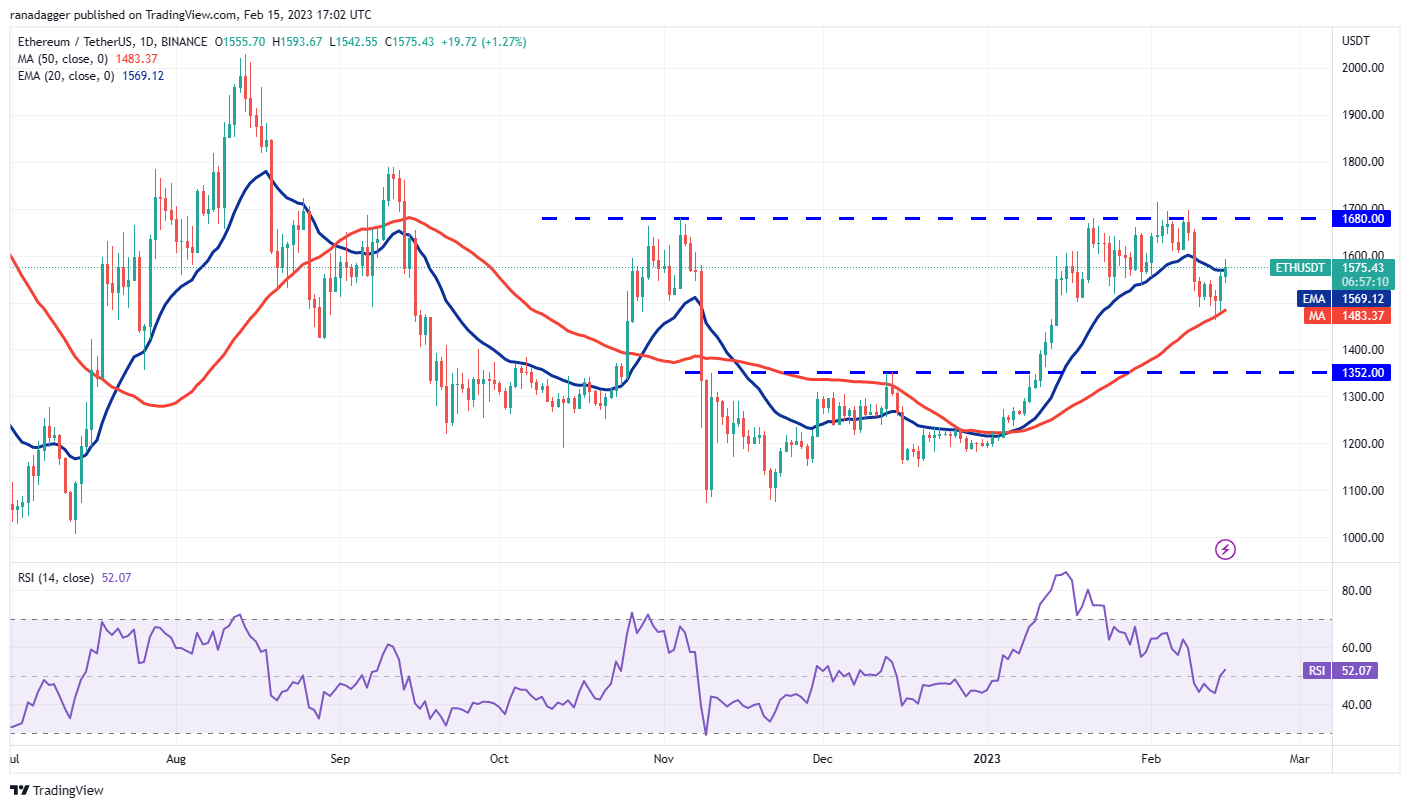
The flattening 20-day EMA ($1,569) and the RSI near the midpoint suggest a balance between supply and demand. A break above the 20-day EMA will tilt the advantage in favor of the buyers. The ETH/USDT pair could then retest the solid overhead resistance at $1,680.
On the contrary, if the price turns down from the current level and plummets below the 50-day simple moving average (SMA), it will signal an advantage to bears. That may start a deeper correction to the next strong support at $1,352.
BNB/USDT
BNB (BNB) plunged below the 50-day SMA ($293) on Feb. 13, but the bears could not build upon this advantage. The long tail on the day’s candlestick shows strong buying near $280.
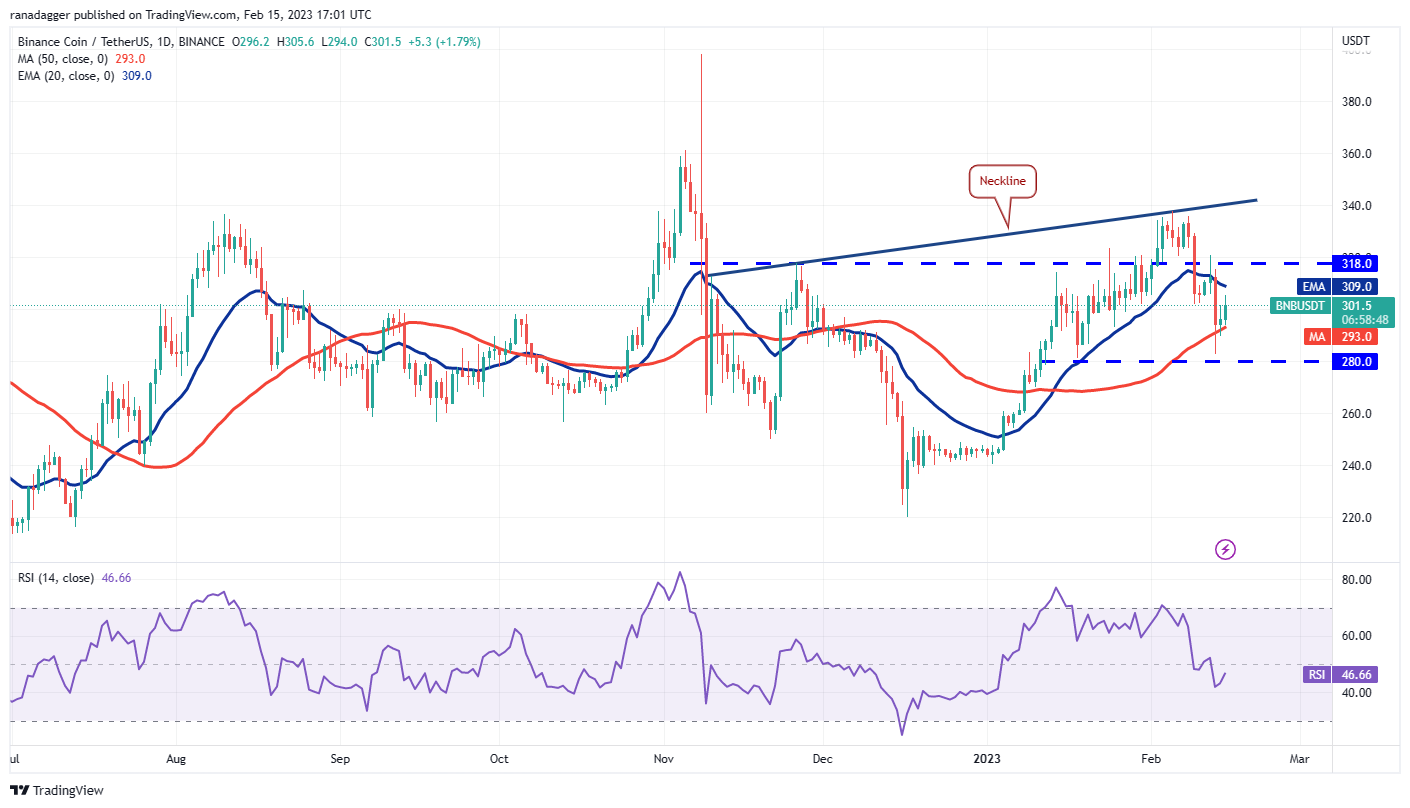
The 20-day EMA has started to turn down, and the RSI is in the negative territory, indicating that bears have a slight edge. The next drop to $280 increases the risk of a breakdown. Below this support, the BNB/USDT pair could extend its decline to $260.
If the price turns up from the current level and rises above the 20-day EMA, it will indicate solid demand at lower levels. That could enhance the prospects of a rally to the neckline of the bullish inverted head-and-shoulders (H&S) pattern.
XRP/USDT
XRP (XRP) jumped up from the strong support at $0.36 on Feb. 14 and reached the 50-day SMA ($0.38). The bears are likely to sell the relief rally to the moving averages.
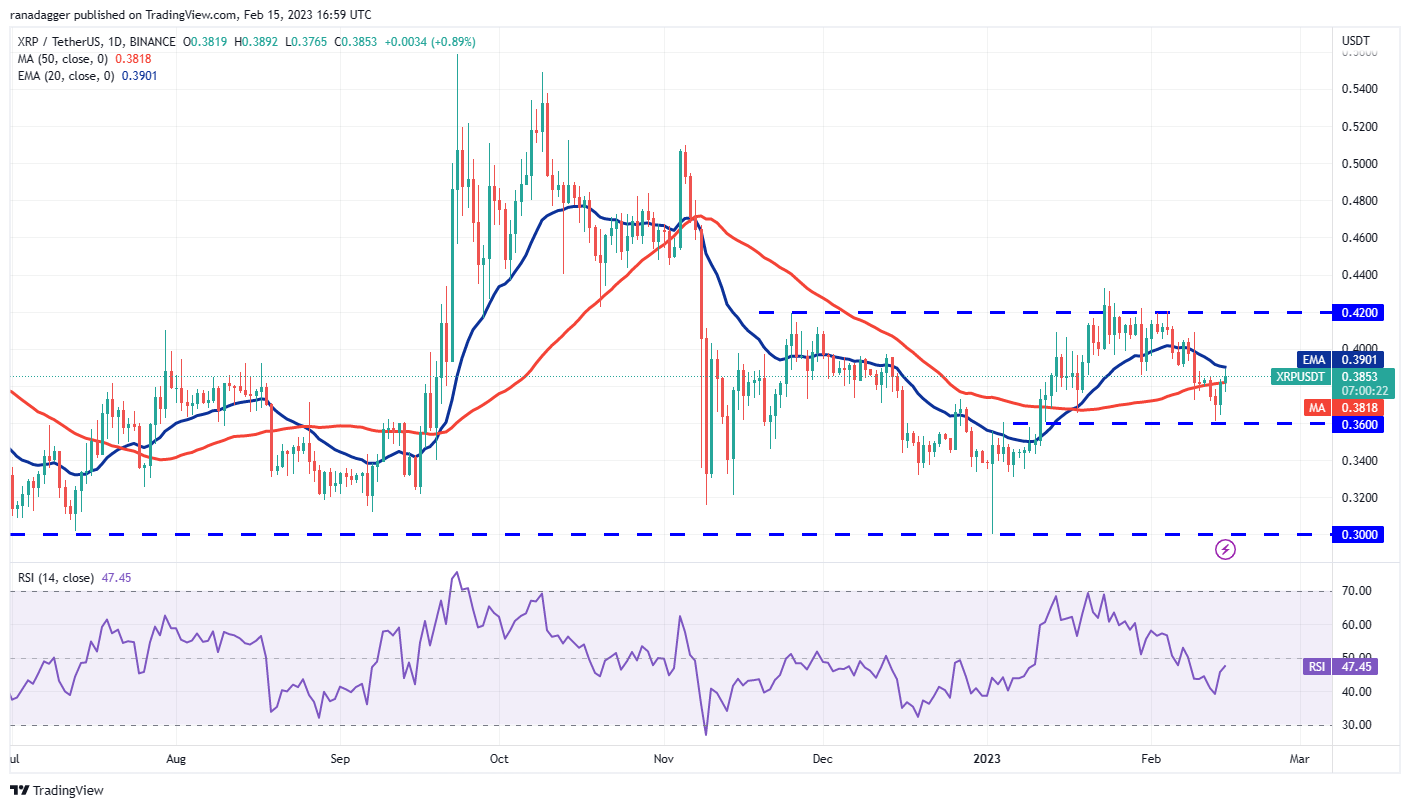
If the price turns down from the current level, it will suggest that bears are selling on rallies. That may result in a retest of the support at $0.36. This is an important level for the bulls to defend because if it cracks, the XRP/USDT pair will form a head-and-shoulders pattern. This bearish setup has a target objective of $0.29.
Alternatively, if the price rises above the moving averages, it will indicate that the pair may oscillate between $0.42 and $0.36 for a while longer.
ADA/USDT
Cardano’s ADA (ADA) attracted solid buying at the 50-day SMA ($0.34), as seen from the long tail on the Feb. 13 candlestick. The bulls followed it up with another strong up-move on Feb. 14 that rose above the 20-day EMA ($0.38).
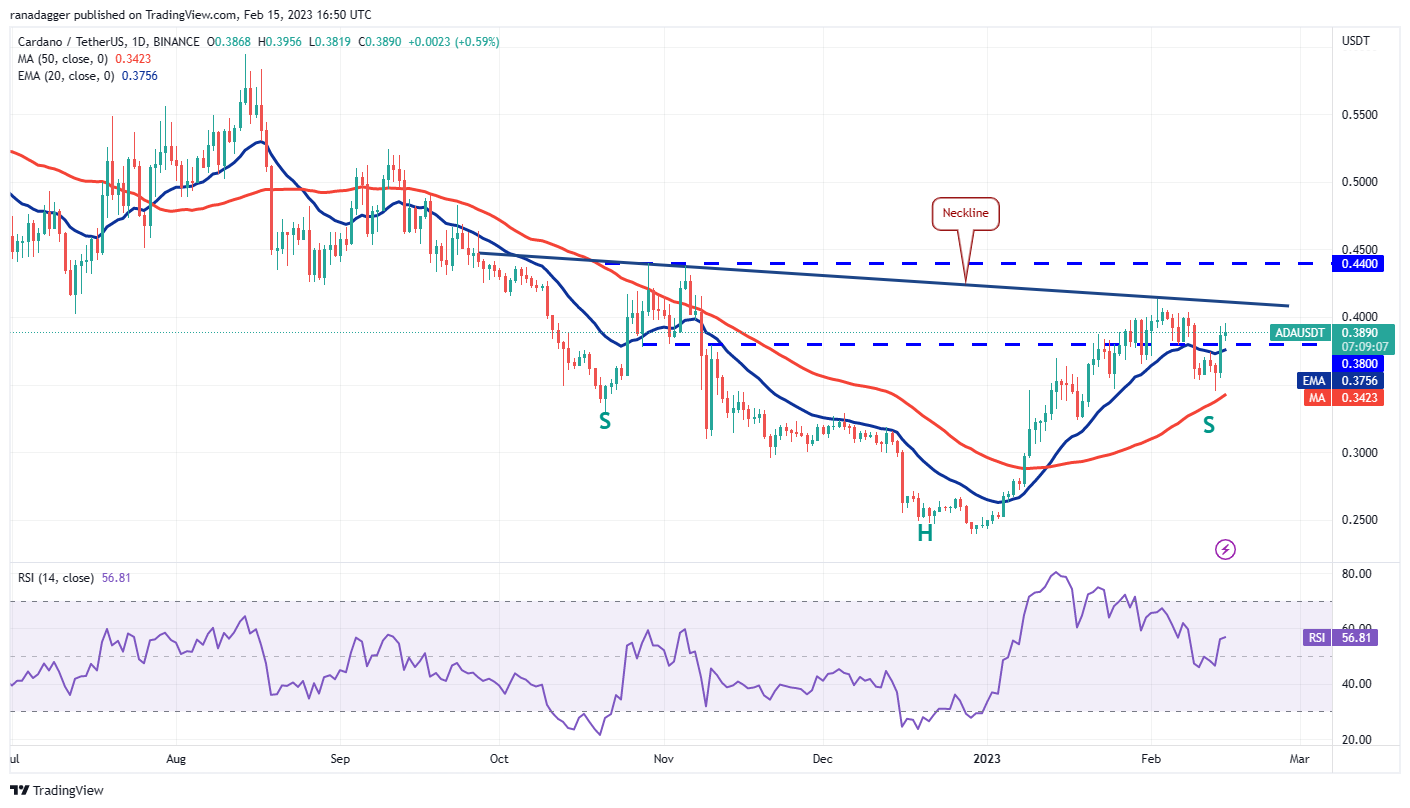
If the price sustains above the 20-day EMA, the bulls will try to propel the ADA/USDT pair above the neckline of the inverse head-and-shoulders pattern. If they succeed, the pair could pick up momentum and soar above the immediate resistance at $0.44. The next major hurdle is $0.52, and if this is crossed, the rally may extend to the pattern target of $0.60.
Contrarily, if the price turns down and breaks below the 20-day EMA, it will suggest that bears are trying a comeback. They will have to sink the price below $0.34 to gain the upper hand.
DOGE/USDT
Repeated attempts by the bears to sustain Dogecoin (DOGE) below the 50-day SMA ($0.08) have failed in the past few days. This shows strong demand at lower levels.
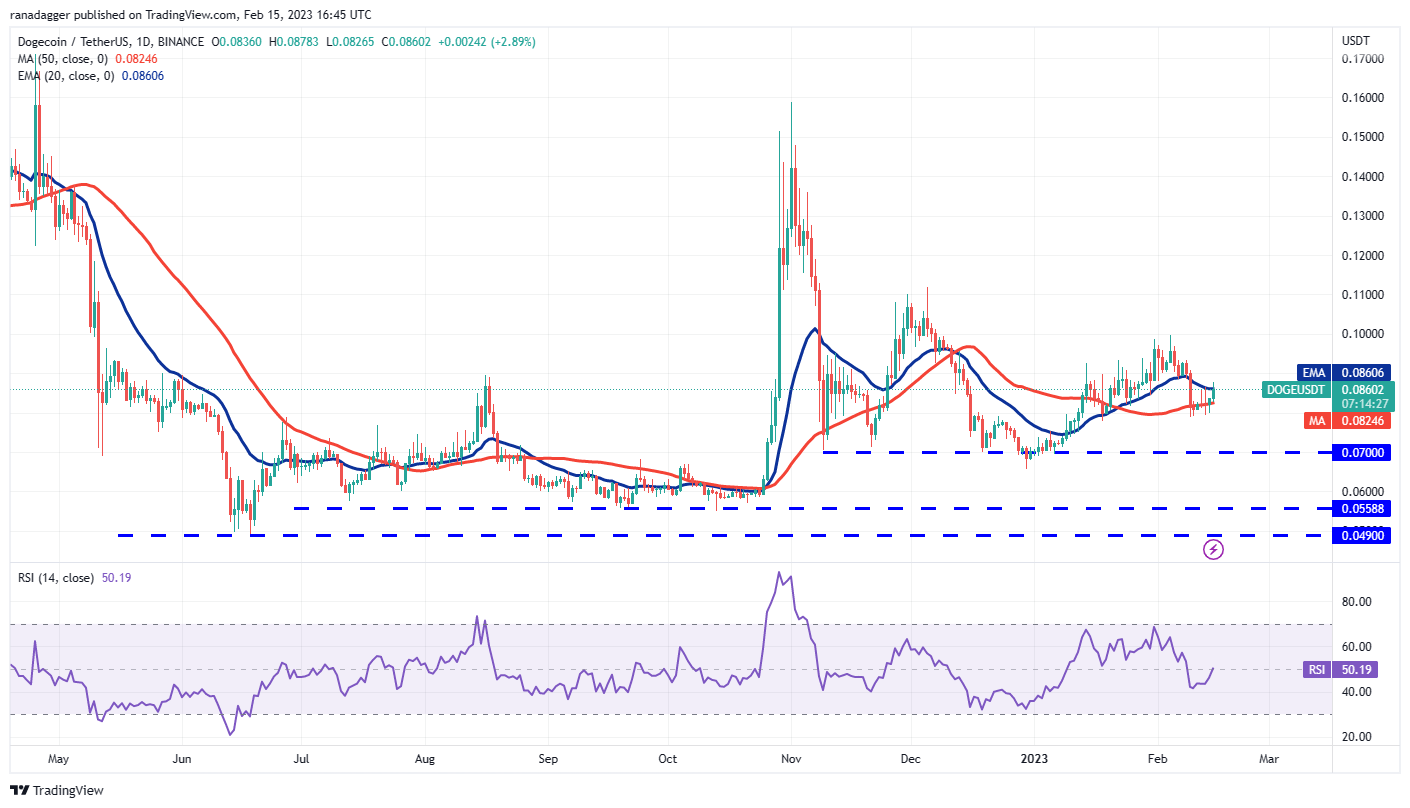
The bulls will now try to sustain the price above the 20-day EMA ($0.08). If they manage to do that, the DOGE/USDT pair could rise to the overhead resistance zone between $0.10 and $0.11. The bears are expected to defend this zone with all their might.
Another possibility is that the price turns down from the 20-day EMA. If that happens, it will suggest that the bears are trying to flip the 20-day EMA into resistance. The pair could then fall to the 50-day SMA and eventually to the strong support at $0.07.
MATIC/USDT
The bears pulled Polygon’s MATIC (MATIC) below the 20-day EMA ($1.19) on Feb. 13 and Feb. 14, but they could not sustain the lower levels. This shows that the bulls are not willing to give up their advantage.
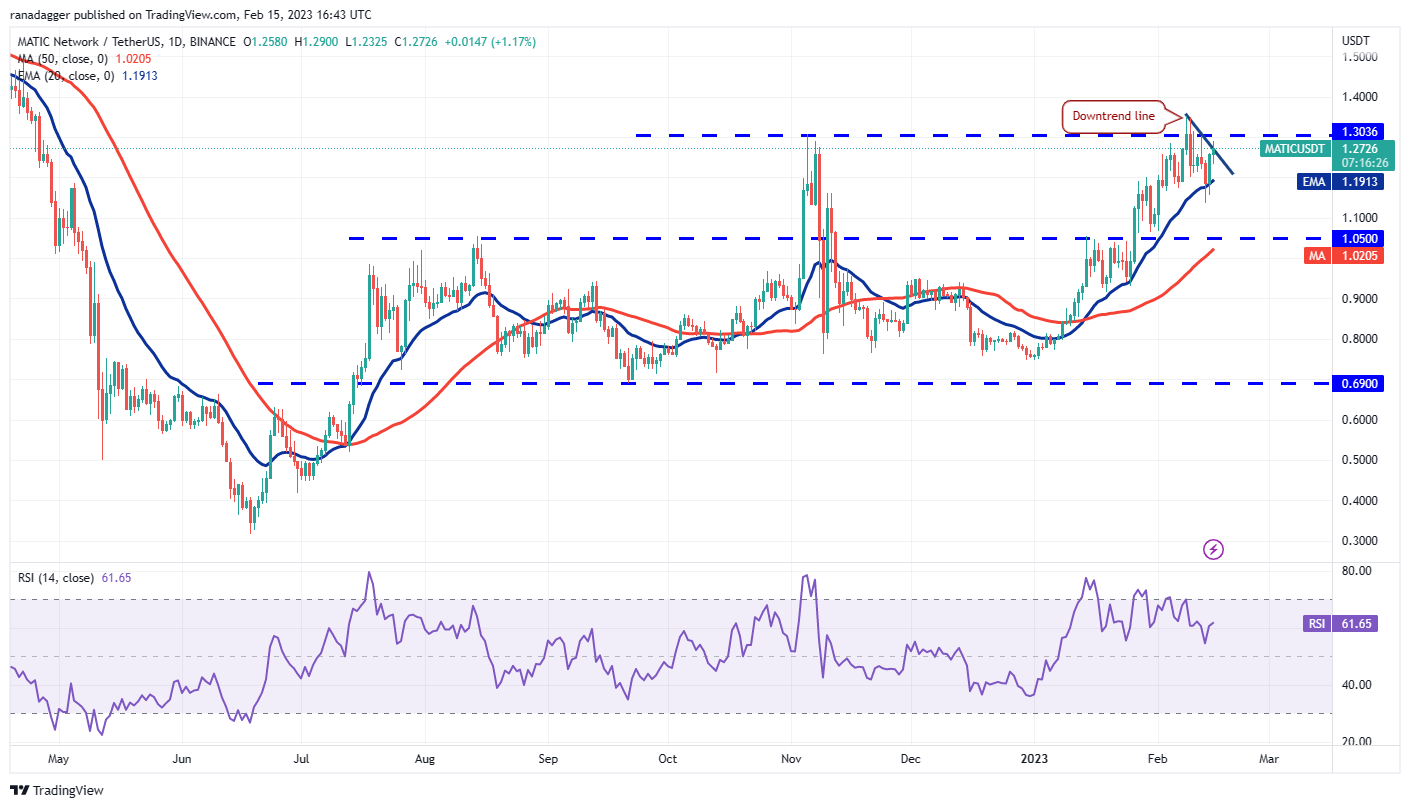
If bulls thrust the price above the downtrend line, the MATIC/USDT pair could attempt a rally to $1.35. Such a move will enhance the prospects of the continuation of the up-move. If $1.35 is scaled, the rally may extend to $1.75.
Instead, if the price turns down sharply from the downtrend line, it will suggest that bears are selling on every minor rally. The next dip below the 20-day EMA may open the gates for a possible slide to $1.05.
Related: 3 reasons why Binance’s BNB token risks sliding further by March
SOL/USDT
Solana’s SOL (SOL) has been stuck between the moving averages since Feb. 9, which suggests indecision among the bulls and the bears.
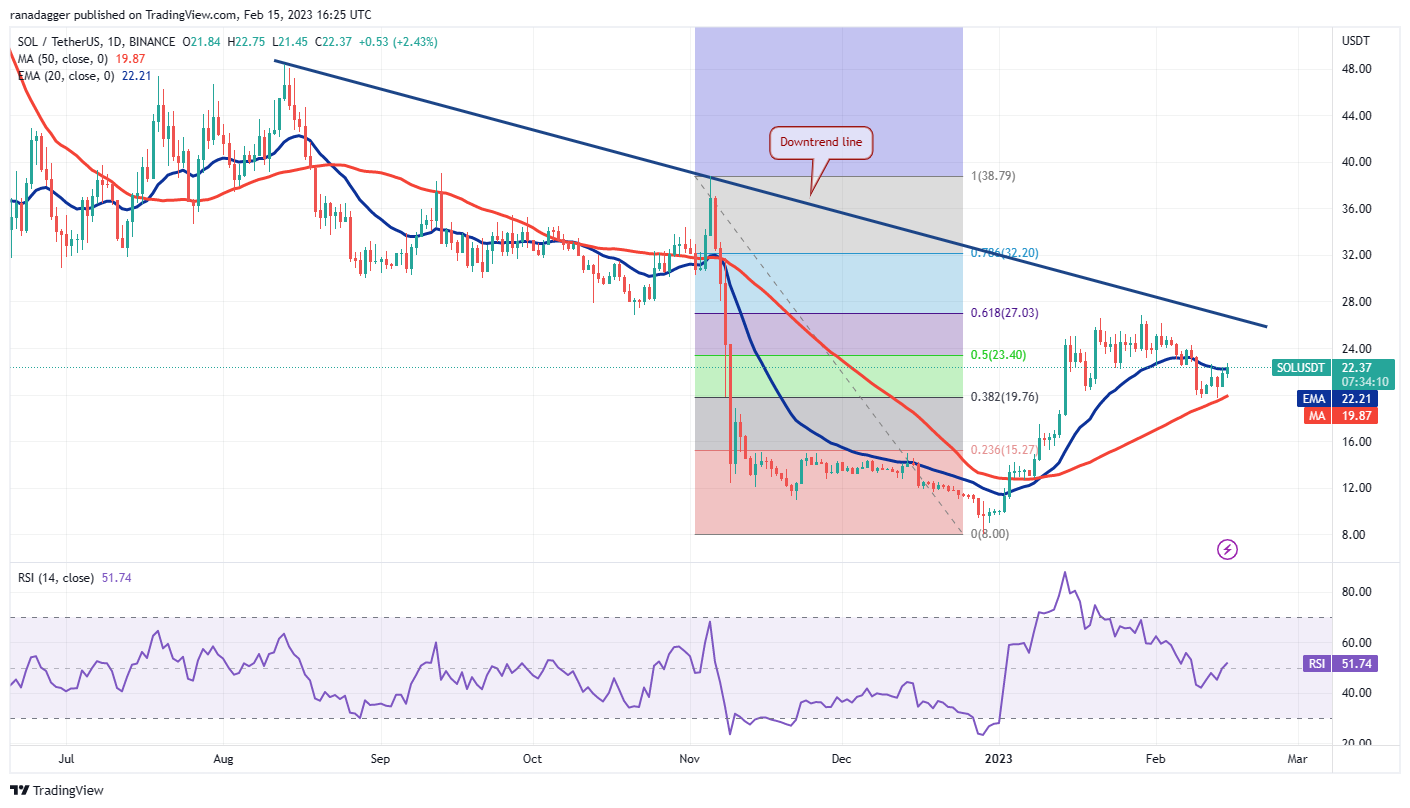
The flattish 20-day EMA ($22.21) and the RSI at the midpoint also do not give a clear advantage either to the bulls or the bears. This indicates that the SOL/USDT pair may swing between the downtrend line and the 50-day SMA for some time.
If the price breaks below the 50-day SMA, the selling may intensify, and the pair is likely to slump to $15. Conversely, if bulls kick the price above the downtrend line, the pair could complete a 100% retracement and rise to $39.
DOT/USDT
The bears tried to pull Polkadot’s DOT (DOT) below the 50-day SMA ($5.76) on Feb. 13 and Feb. 14, but the long tail on the candlestick shows strong buying at lower levels.
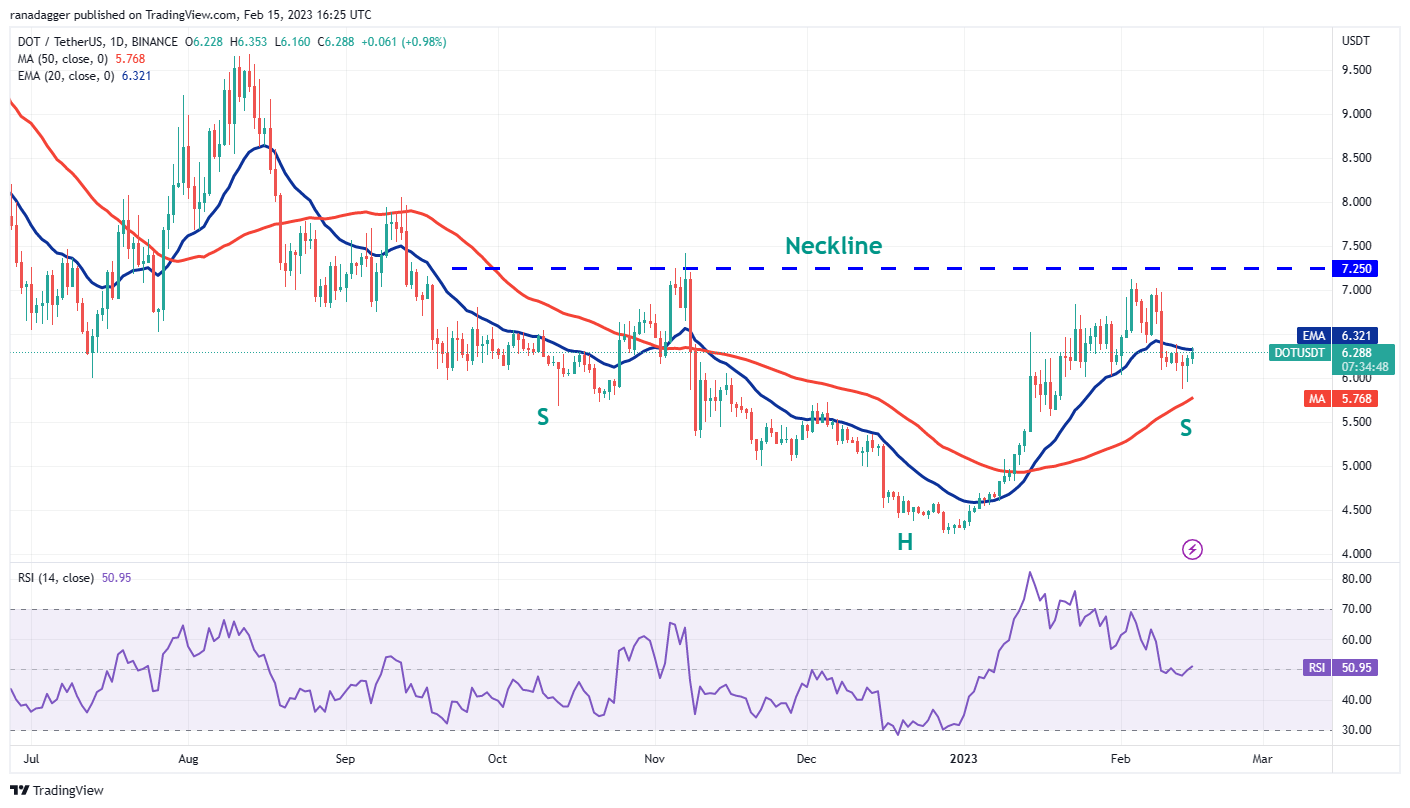
The bulls will try to build upon this advantage and thrust the price above the 20-day EMA ($6.32). If they can pull it off, the DOT/USDT pair could start its journey toward the overhead resistance at $7.25. This will form an inverse H&S pattern, which will complete on a break above $7.25. This reversal setup has a pattern target of $10.28.
Instead, if the price turns down and breaks below the 50-day SMA, it will suggest that bears have flipped the 20-day EMA into resistance. That could start a deeper correction to $4.35.
LTC/USDT
The long tail on Litecoin’s (LTC) Feb. 13 candlestick shows that the bulls are buying the dips to the 50-day SMA ($86). Buyers continued their purchase on Feb. 14 and cleared the 20-day EMA ($93) hurdle.
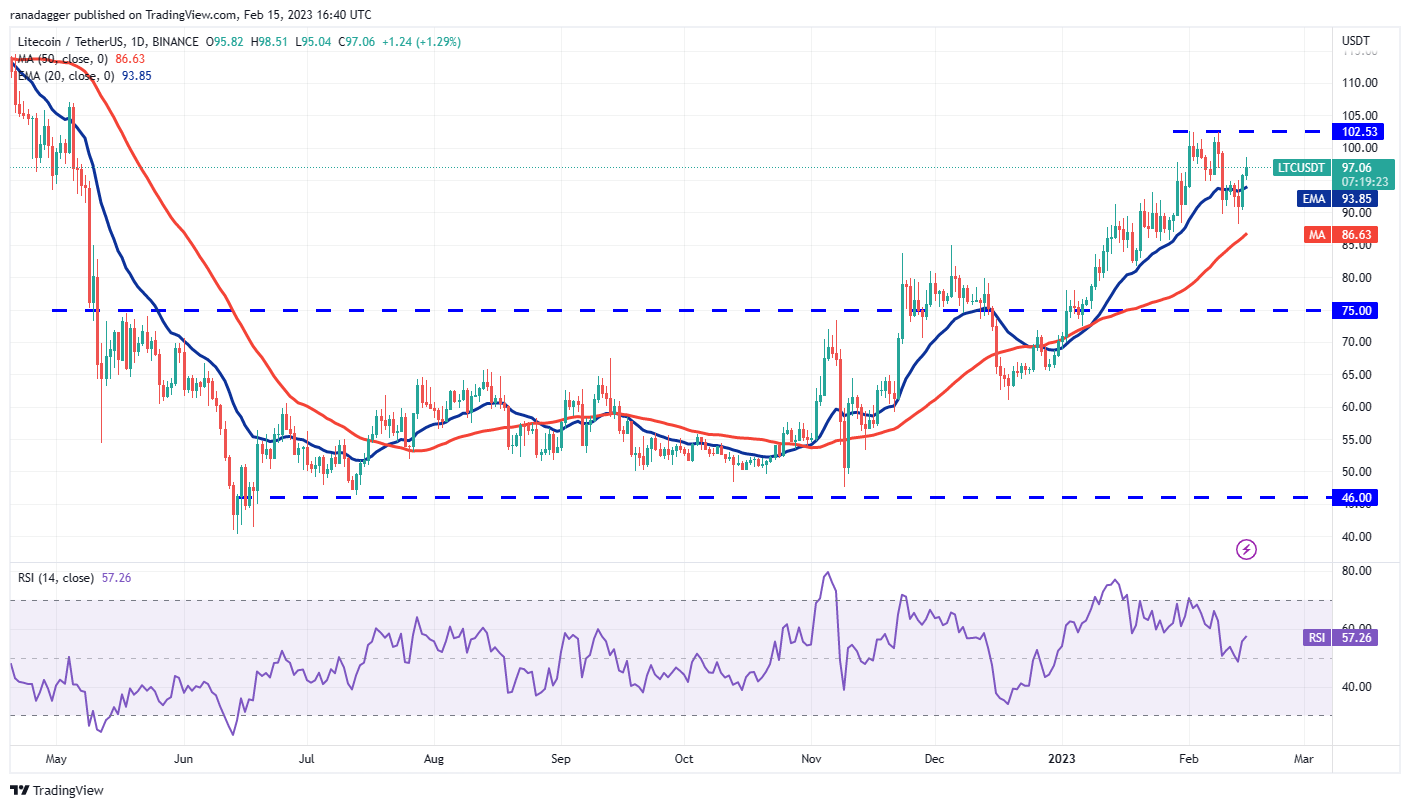
The price is stuck between $102.53 on the upside and $88 on the downside. The flattish 20-day EMA and the RSI above 57 point to a possible range-bound action in the near term.
A consolidation near the local highs is a positive sign, as it suggests that stronger hands continue to hold on to their position as they anticipate the up-move to resume. A break above $102.53 could clear the path for a possible rise to $115.
This positive view could be negated in the near term if the price turns down and plummets below $88. The pair may then tumble to $81 and later to $75.
The views, thoughts and opinions expressed here are the authors’ alone and do not necessarily reflect or represent the views and opinions of Cointelegraph.
This article does not contain investment advice or recommendations. Every investment and trading move involves risk, and readers should conduct their own research when making a decision.


