

Bitcoin price has been range-bound for 126 days, but analysts say an explosive move is imminent.
Bitcoin’s (BTC) lack of volatility has been the dominant discussion point among traders for the past two weeks and the current sideways trading within the $18,000 to $25,000 range has been in effect for 126 days. A majority of traders agree that a significant price move is imminent, but exactly what are they basing this thesis on?
Let’s take a look at three data points that predict a spike in Bitcoin volatility.
Muted volatility and seller exhaustion
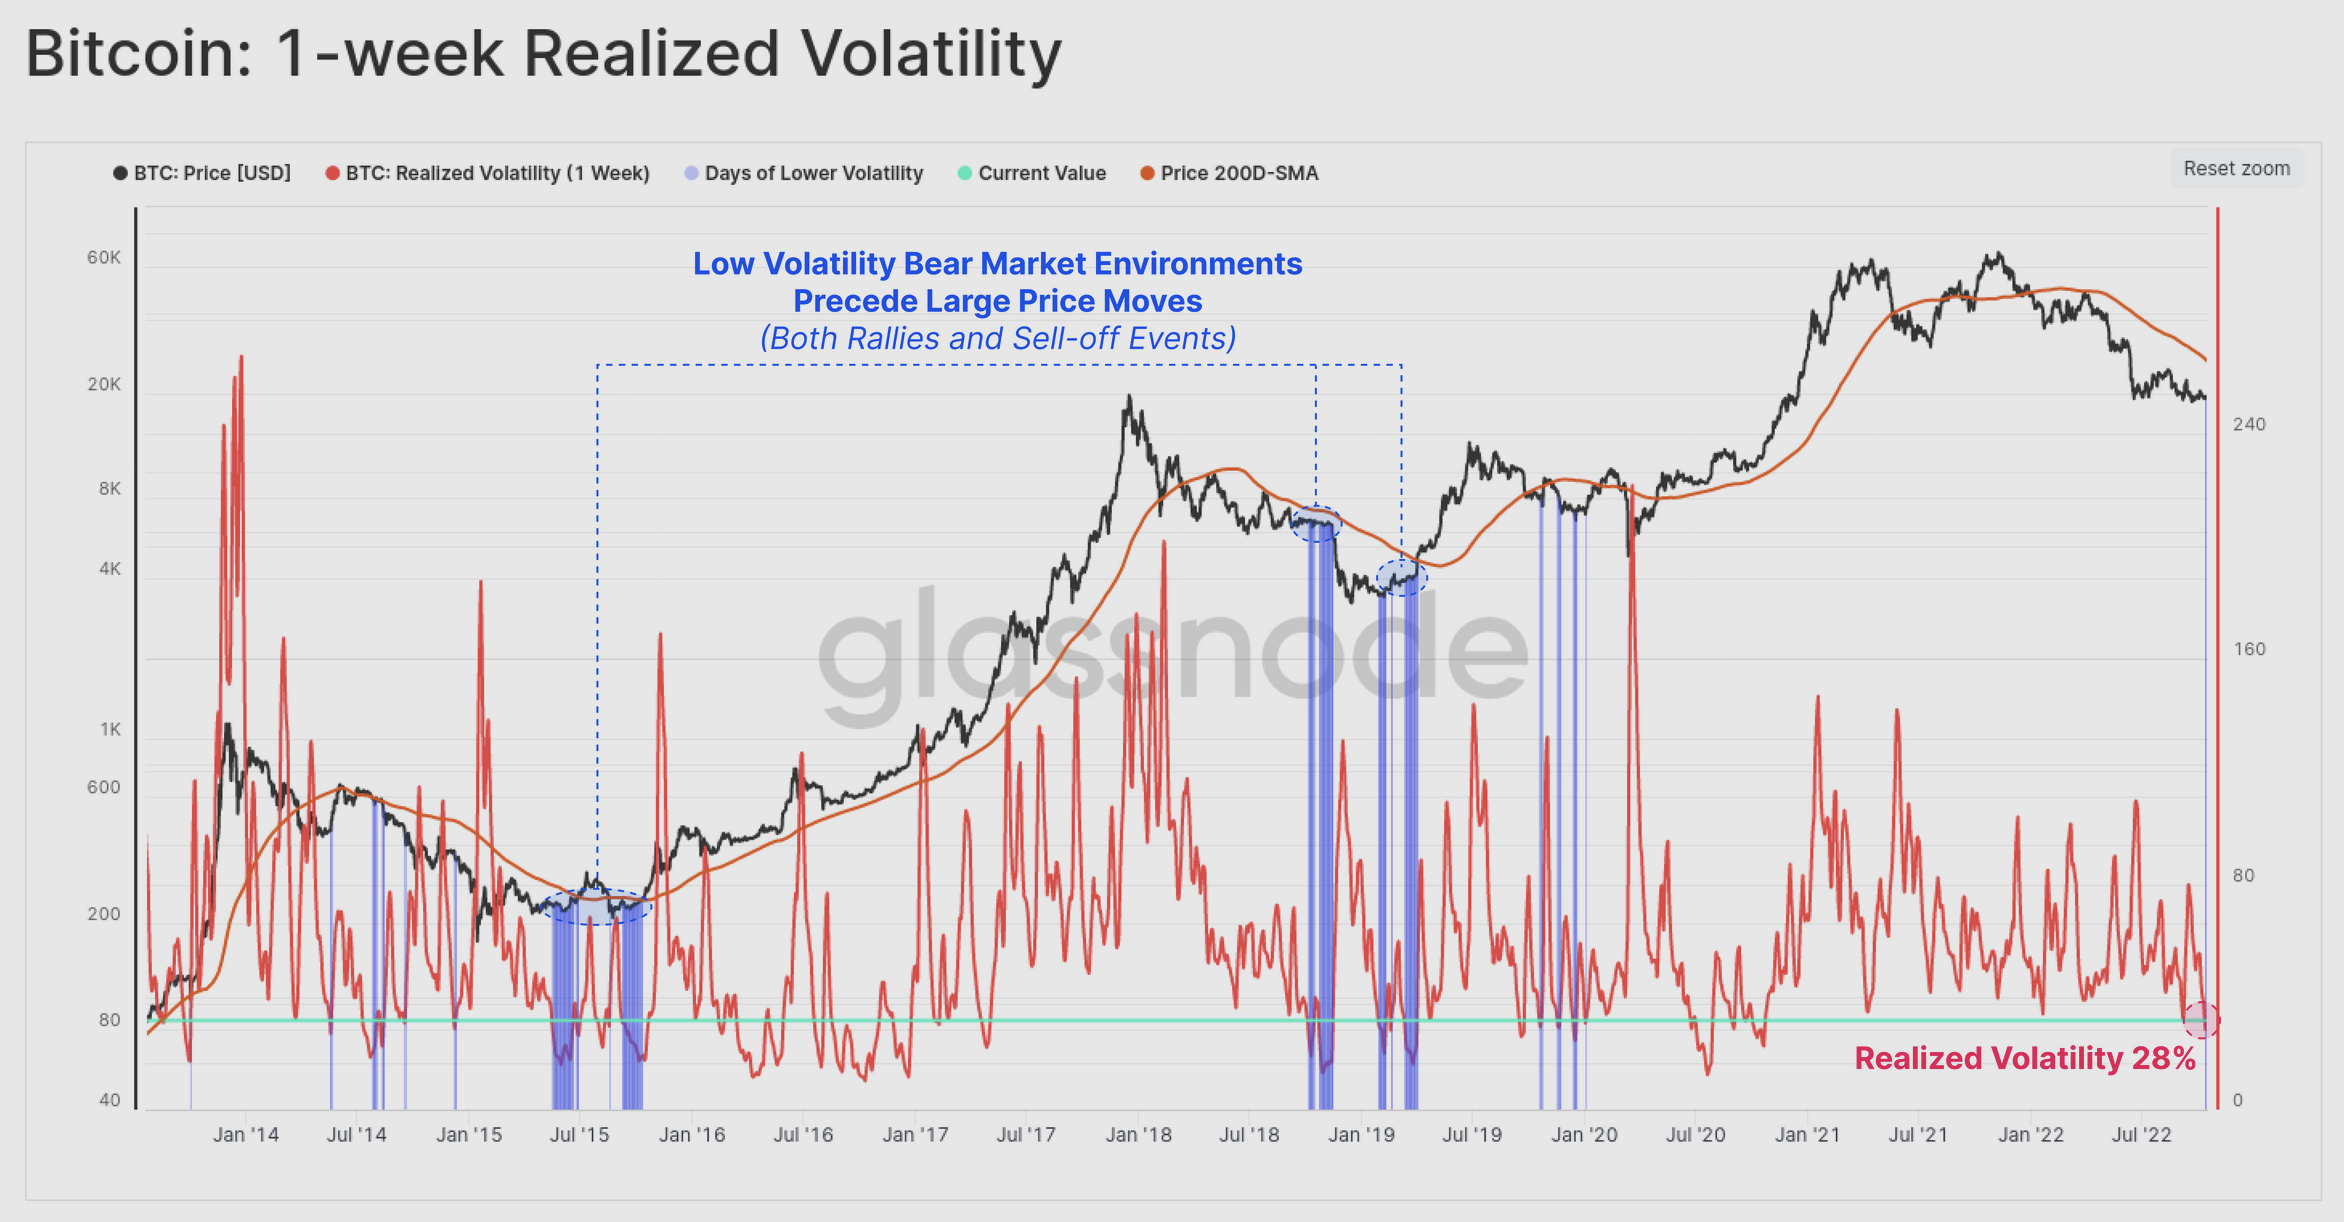
According to Glassnode research, the “Bitcoin market is primed for volatility,” with on- and off-chain data flashing multiple signals. The researchers note that on-week realized volatility has fallen to 28%, a level that is typically followed by a sharp price move.
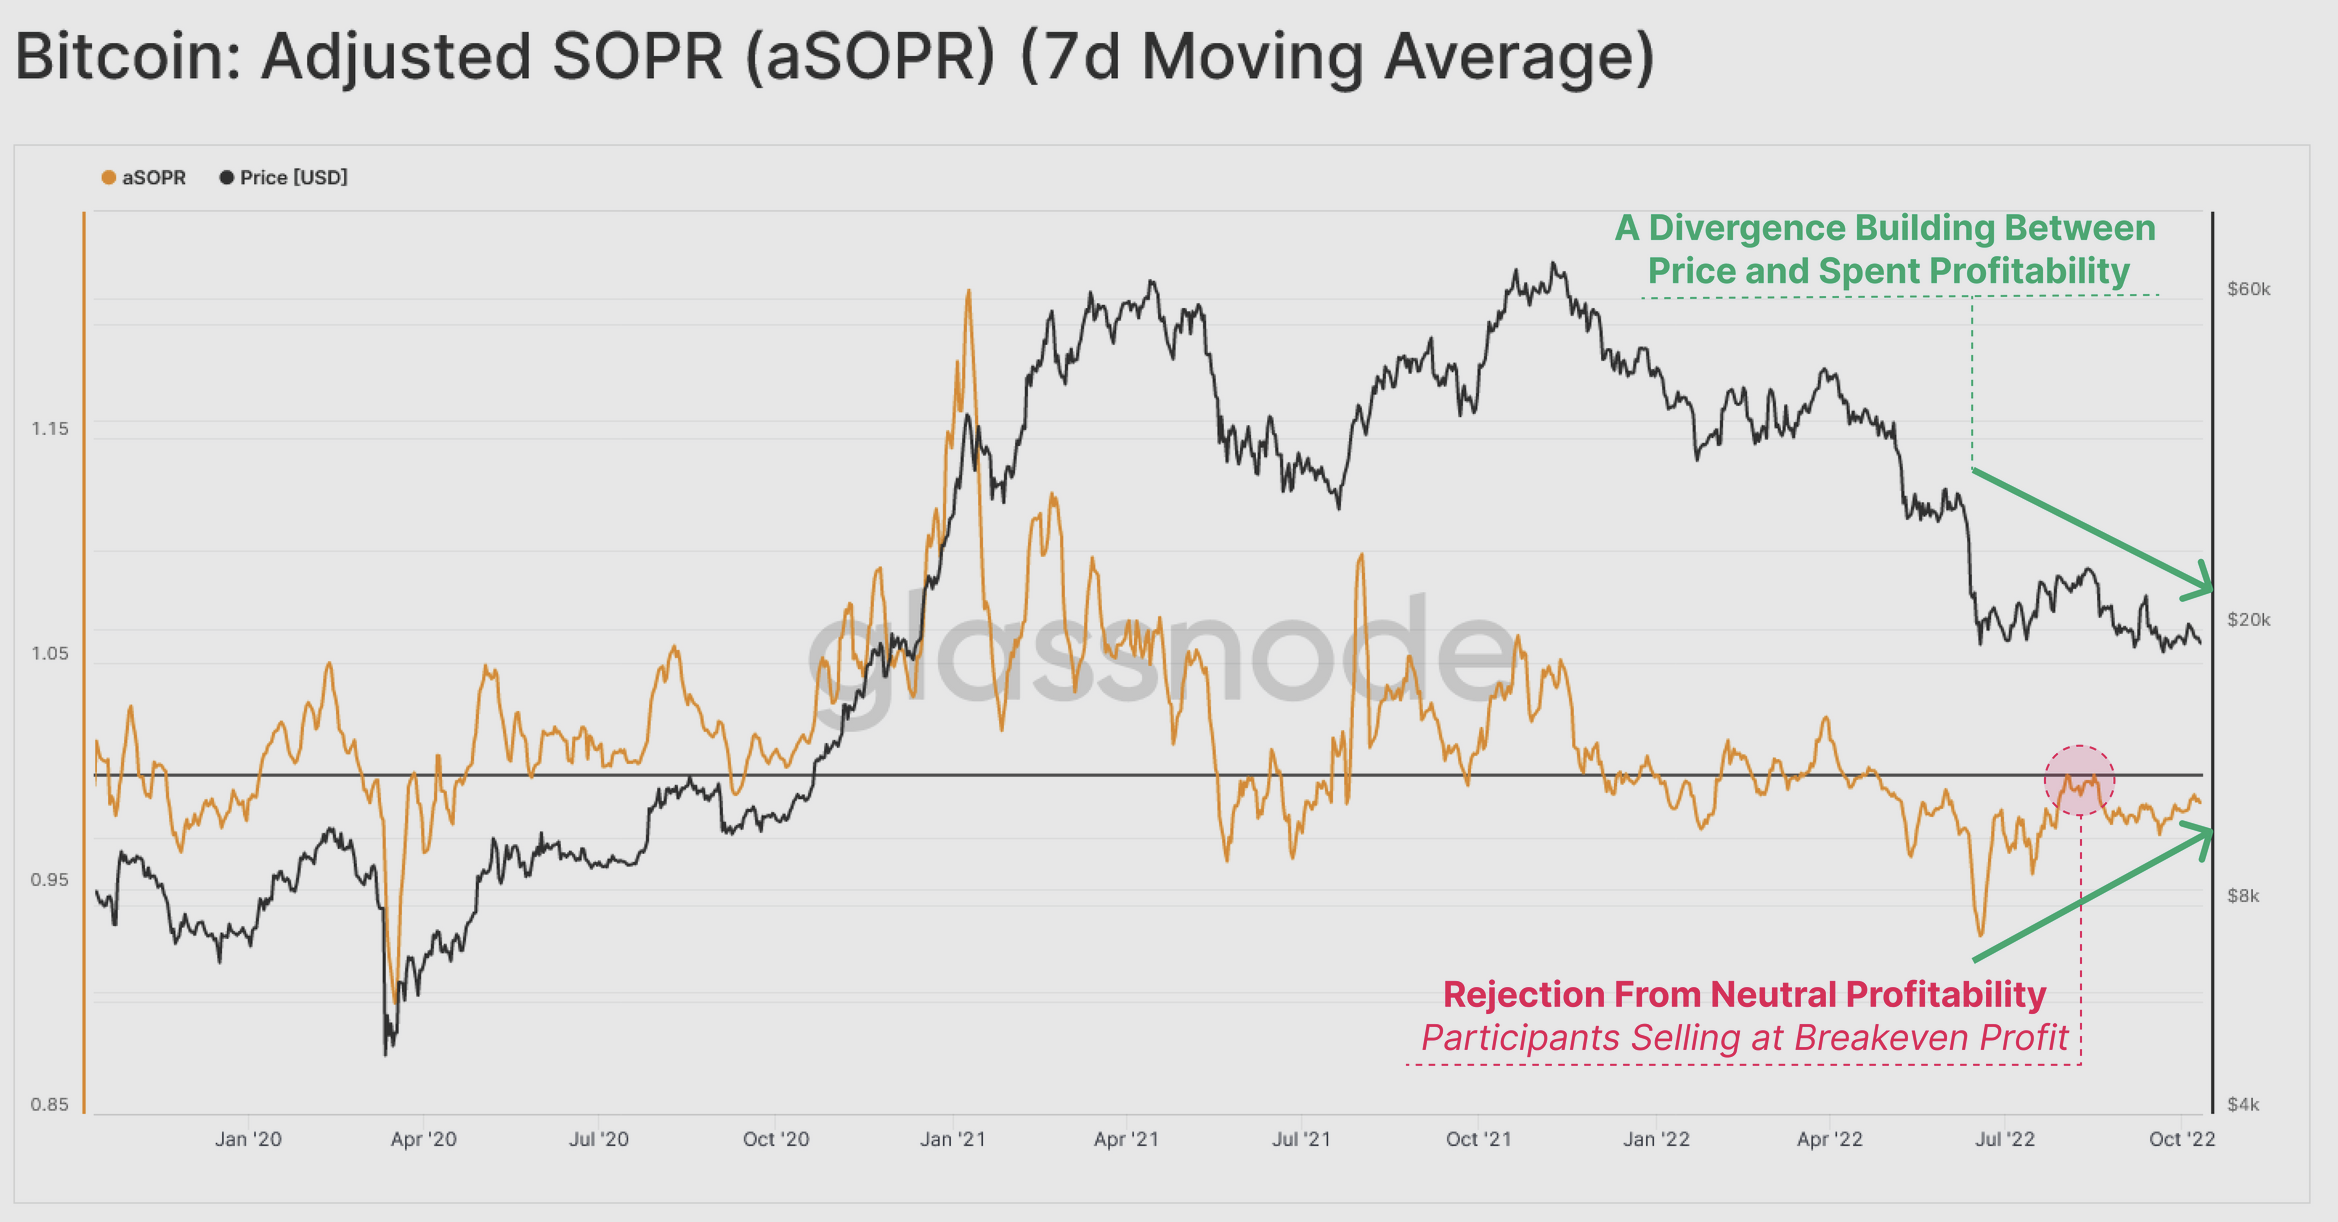
Exploration of Bitcoin’s aSOPR, a metric that “measures an average realized profit/loss multiple for spent coins on any given day,” shows:
“A large divergence is currently forming between price action, and the aSOPR metric. As prices trade sideways or decline, the magnitude of losses that being locked in are diminishing, indicating an exhaustion of sellers within the current price range.”
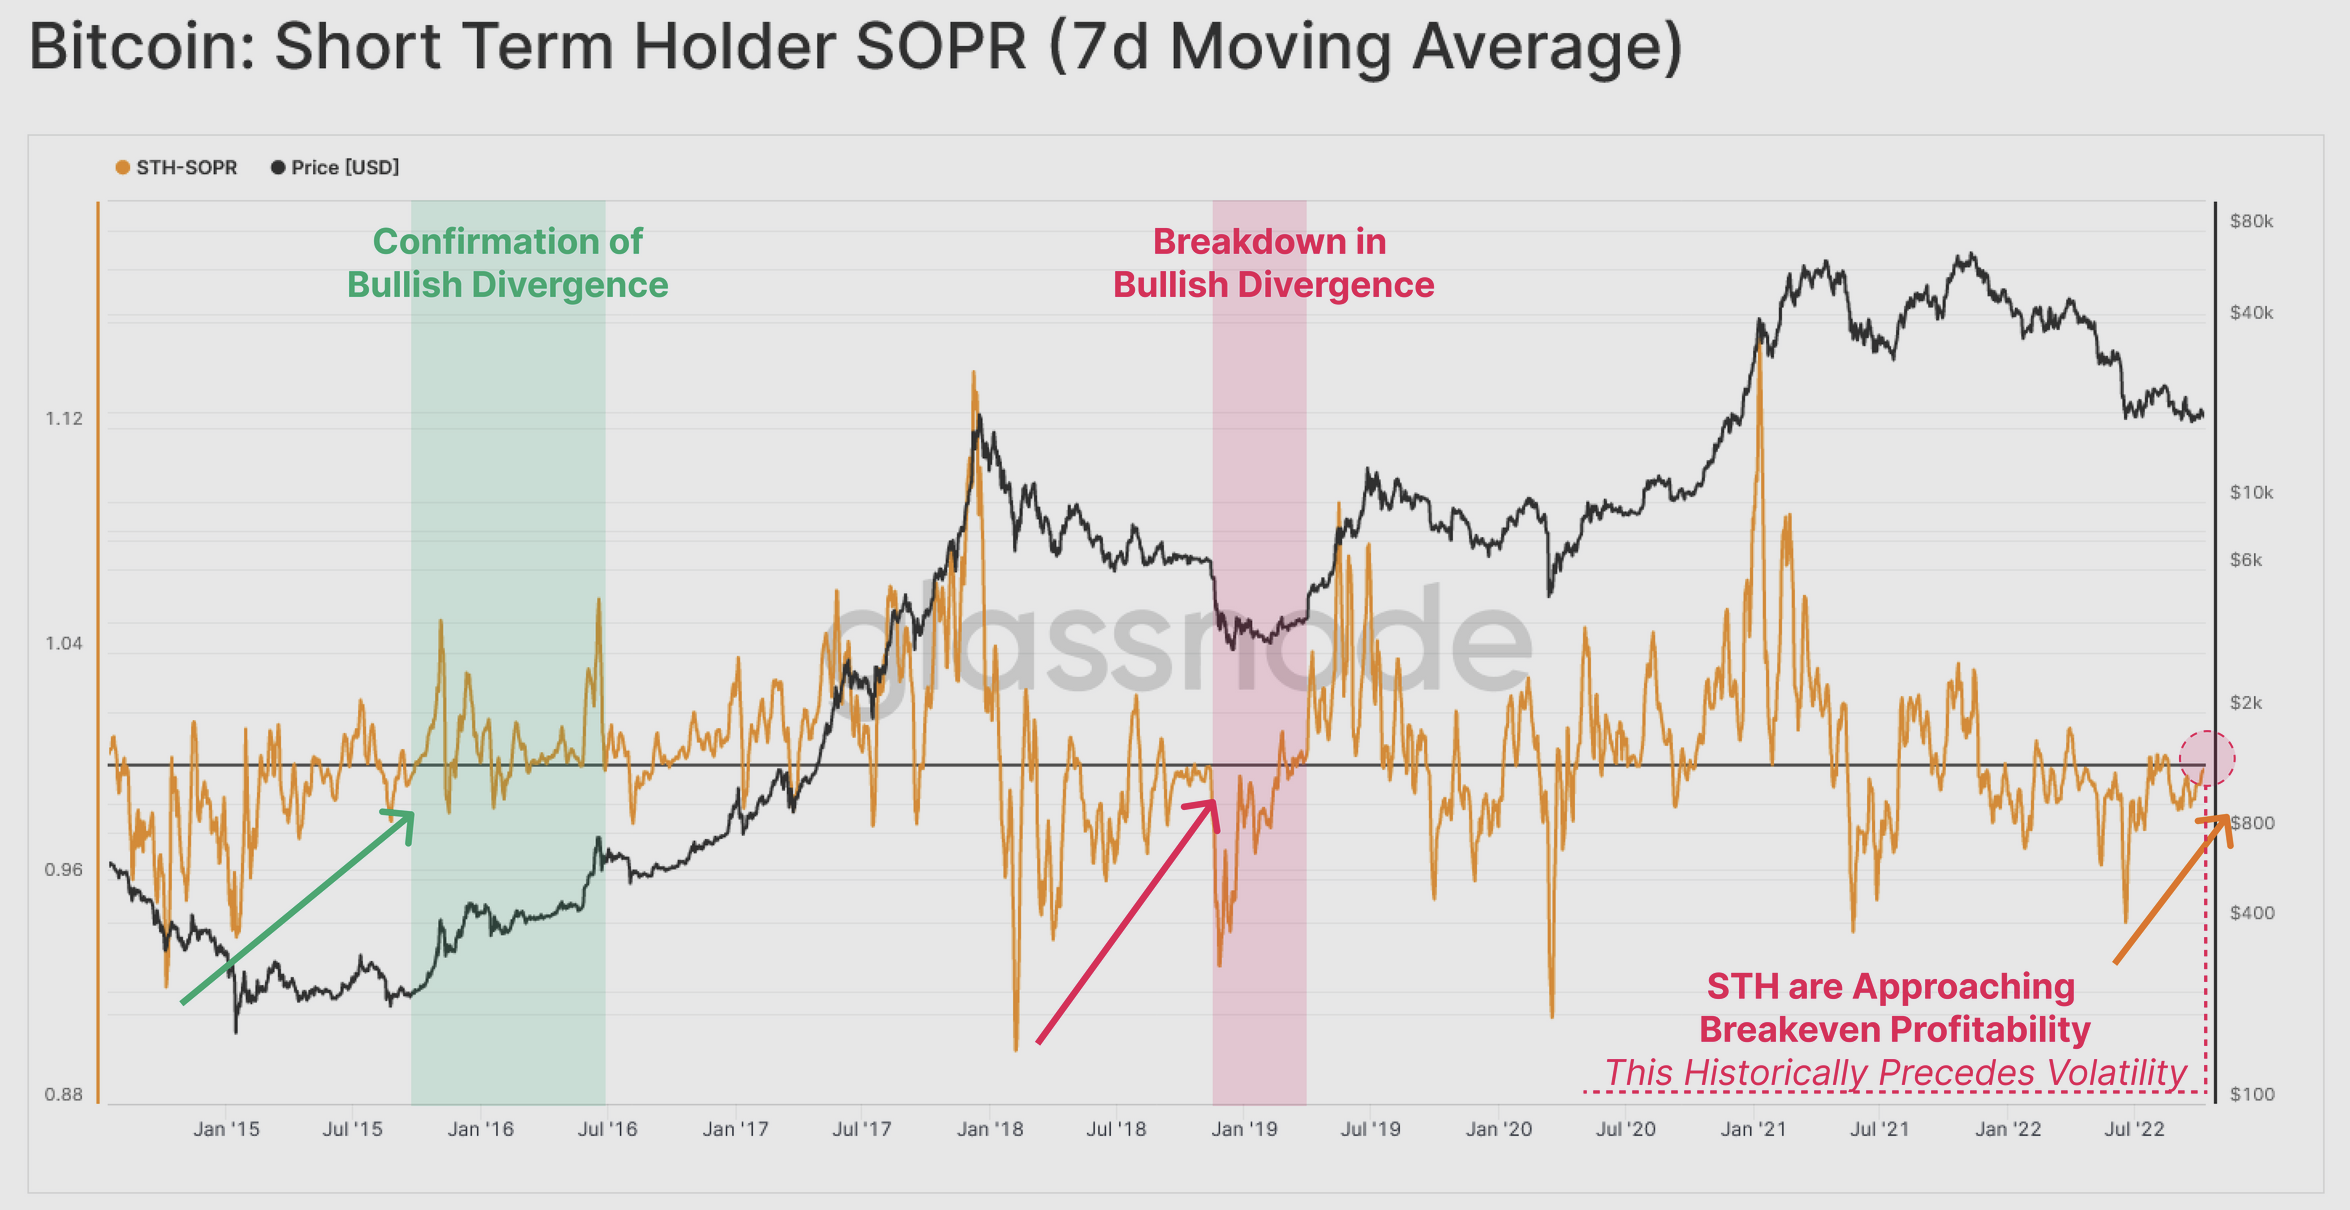
In addition to the divergence between the price and the adjusted SOPR, short-term Bitcoin holders are approaching their breakeven level as the short-term holder SOPR approaches 1.0.
This is significant because a reading of 1.0 during a bear market has historically functioned as a level of resistance and there is a tendency for traders to exit their positions near breakeven.
If the aSPOR were to crest above 1.0 and turn the level to support, it could be an early sign of a fledgling trend change within the market.
Trading indicators are also at pivot points
Multiple technical analysis indicators are also flashing a signal that a strong directional move is in the cards, a point noted by independent market analyst Big Smokey.
According to the analyst:
Bitcoin price range, SuperGuppy and Bollinger Bands are getting real tight. ETH looks the same. You know what that means. pic.twitter.com/e7s6ScG7jz
— Big Smokey (@big_smokey1) October 18, 2022
Crypto research firm Delphi Digital recently issued a similar perspective, citing “compression” within the Guppy Multiple Moving Average as a sign of “shorter-term momentum and the potential for a rally as this cohort attempts to flip the longer-term moving averages.”
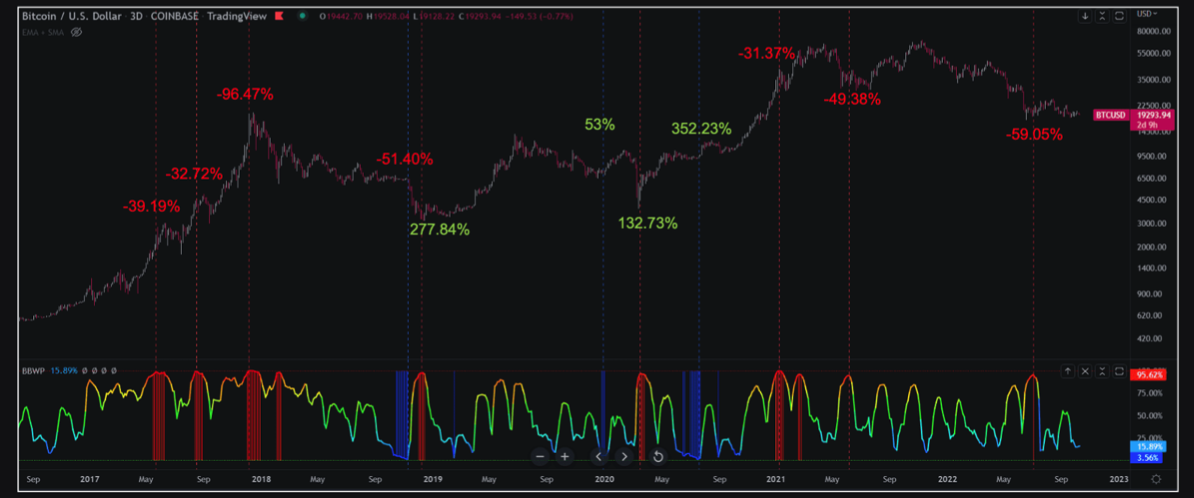
On Oct. 10, Delphi Digital researchers referenced the Bollinger Band Width Percentile (BBWP) metric and suggested the possibility of “a big move brewing for BTC.” The researchers explained that “Historically, BBWP readings above 90 or below 5 have marked major swing points.”
Related: Bitcoin mirrors 2020 pre-breakout, but analysts at odds whether this time is different
The state of Bitcoin derivatives
Crypto derivatives markets are also flashing multiple signals. Bitcoin futures open interest has reached an all-time high of 633,000 contracts, while trading volumes have plummeted to a multi-year low of $24 billion daily. Glassnode notes that these levels were “last seen in December 2020, before the bull cycle had broken through the 2017 cycle $20K ATH.”
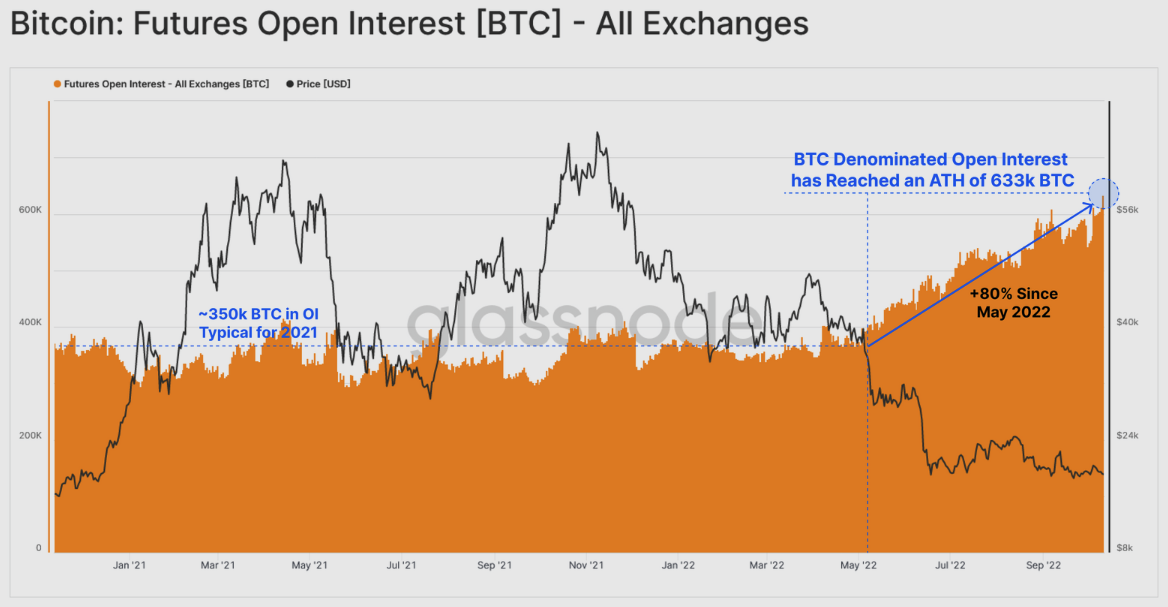
As one would expect during a bear cycle, liquidity, or the amount of money flowing in and out of the market, has declined, reinforcing the reason for believing that an eventual spike in volatility could result in a sharp price move.
While derivatives metrics like futures open interest, long liquidations and coin-margined futures open interest are breaking multi-year records, it’s important to note that neither provides absolute certainty on market directionality. It’s difficult to determine whether a majority of market participants are positioned long or short and most analysts will suggest that the surge in open interest is reflective of hedging strategies that are in play.
One thing that is certain is that on-chain data, derivatives data and basic technical analysis indicators all point toward an impending explosive move in Bitcoin price.
Bitcoin’s current prolonged period of low volatility is somewhat unusual, but reviewing the data presented by Glassnode and Delphi Digital could provide valuable insight into what to expect when certain on-chain metrics hit specific thresholds and this should give investors some ideas on how to position.
The views and opinions expressed here are solely those of the author and do not necessarily reflect the views of Cointelegraph.com. Every investment and trading move involves risk, you should conduct your own research when making a decision.


